F I NAN C I A L R E V I EW
100
80.0
60.0
40.0
20.0
0
120
100
80
60
40
20
0
Healthcare
2014
2015
2014
2015
2014
2015
2014
2015
Leisure
Property
Investments
America
Middle East
Europe
Asia
50.0
40.0
30.0
20.0
10.0
0
Healthcare
Group
Property
Leisure
Investments
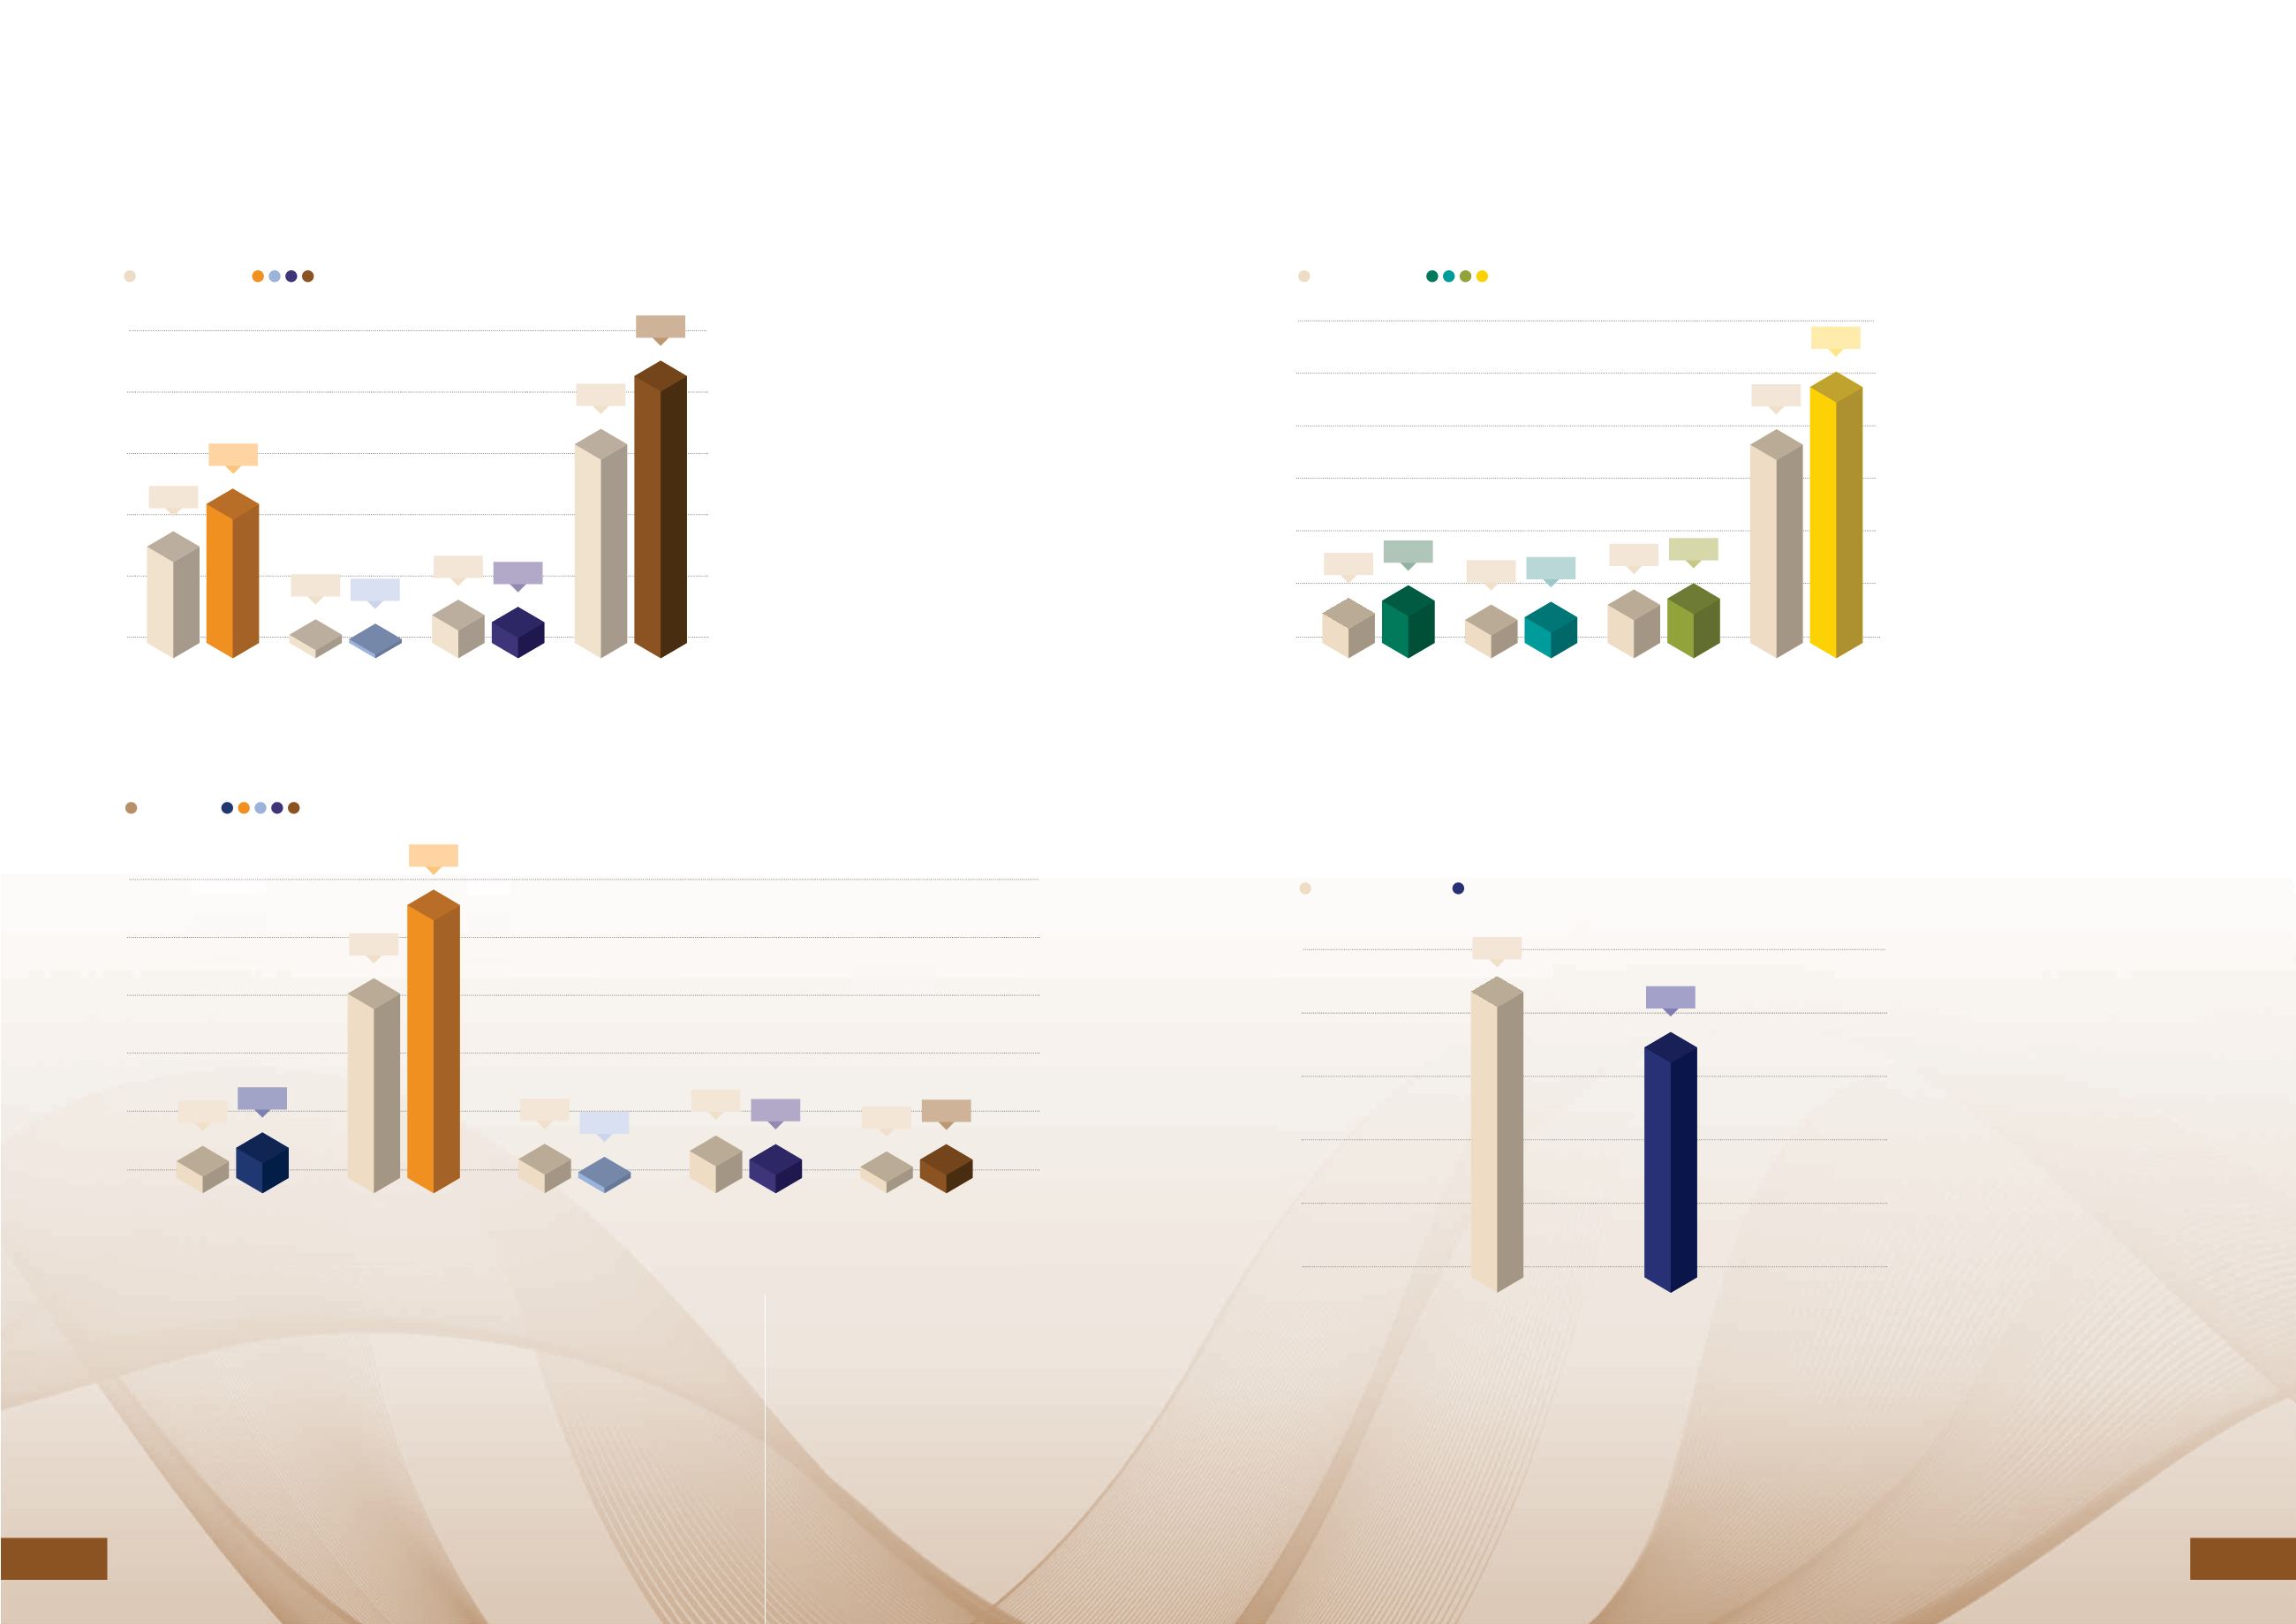
OVERVIEW
Group revenue at $178.8 million
was 16% higher than 2014, with
Healthcare reporting a 25% growth in
revenue. Profits from both Healthcare
and Investments grew 42% and 32%
respectively. Group earnings increased
54% to $183.3 million due to better
profitability from Healthcare, higher
investment income and associated
companies.
Earnings per share increased to 83.7
cents (2014: 54.3 cents). However, net
tangible assets per share decreased
to $11.57 (2014: $12.82) despite
the increase in earnings due to lower
market valuations of available-for-sale
financial assets.
SEGMENTAL PERFORMANCE
HEALTHCARE
Healthcare’s revenue of $152.6 million
increased 25% compared to prior
year. Higher sales to key markets
during the year also resulted in higher
revenue contribution especially from
Asian countries. Sales to Americas and
Asian regions grew 34% and 29%
respectively from the previous year.
Operating profits increased 42% to
$48.1 million due to higher sales, lower
cost of materials and more favourable
exchange rates which helped improve
margins.
LEISURE
The number of visitors to the aquariums
declined by 16% with weaker tourist
sentiments and competition from
newer attractions. Leisure contributed
a lower revenue of $12.7 million in
2015 compared to $15.6 million in
2014 due to lower visitorship and
yield. The segment recorded an
impairment charge of $4.6 million on
its fixed assets at Underwater World
Singapore due to the challenging
operating environment. Excluding the
impairment charge, Leisure reported a
profit of $0.3 million in 2015. The two
aquariums remain cashflow positive.
Continuous upgrading of facilities and
displays at Underwater World Pattaya
are done to maintain competitiveness.
RETURN ON ASSETS EMPLOYED
The Group applies a Return of Assets Employed (“ROA”)
measure to evaluate the performance of its business
operations. The ROA measures profitability of assets
utilised by the various segments.
In 2015, the Group’s ROA increased to 7.1% from 4.6%,
from higher profitability in Healthcare and Investments,
offset by decrease in profit from Leisure and Property. ROA
SEGMENT PROFITS BEFORE INTEREST EXPENSE AND TAX ($M)
HEALTHCARE SALES BY REGION ($M)
VISITORSHIP OF AQUARIUMS (‘000)
RETURN ON ASSETS EMPLOYED (%)
of Healthcare division improved from 32.7% to 47.4%.
The decline in ROA of Leisure to 0.5% is attributable to
lower visitorship and competition from newer attractions.
As a result of lower occupancy rate which impacted on
profitability, ROA of Property decreased to 4.7%. ROA
of Investments increased to 4.1% with higher dividend
income received during the year and smaller asset base.
48.1
2.5
12.4
0.3*
9.9
88.9
67.3
32.7
47.4
4.6
7.1
5.6 4.7
4.4
0.5*
3.1 4.1
33.9
14.5
19.4
17.3 19.7
12.1 12.8
78.3
100.7
* Excludes effects of impairment of fixed assets at Underwater World Singapore.
31
30
1000
800
600
400
200
0
905
756
ANNUAL REPORT 2015
HAW PAR CORPORATION LIMITED


